Since the AMT130 announcement, it’s become popular, especially in online spaces that reward casual contrarianism with clicks, to state with confidence that the reported 75% slowing of clinical progression of Huntington’s disease is “not clinically meaningful”. Such claims invariably rely for support on this single publication by Hamilton et al.
On the face of it, this is troubling – why would anyone want a treatment that is not clinically meaningful to patients? – yet it feels obviously wrong.
Put simply, a 75% slowing of progression amounts to each year of progression being converted into four. Mathematically, this is obvious from the high-school formula v=d/t (velocity equals distance over time). If we rearrange to t=d/v then replace the v by 0.25v to reflect a 75% slowing, the effect is to multiply by 4 the time taken to reach a given destination.
So if a person was destined to become reliant on a wheelchair after one year, the expected effect of treatment would be to increase that to four years. Is it truly possible that three extra years of independent mobility isn’t “clinically meaningful”? Is that really what the Hamilton paper implies?
The answer, of course, is no – but because clinical meaningfulness is a field of study in itself, and we’ve never had this kind of result in an HD trial before, it’s not obvious why that is the answer.
Time for a crash course in clinical meaningfulness – what it is and isn’t, and what it can and can’t tell us – so that we can at least ensure we are talking about the same thing when we consider these results and others yet to come.
What is clinical meaningfulness?
The concept of clinical meaningfulness arose from critiques of the way we typically test treatments in clinical trials. A trial is said to have a “positive” result if the average change in a pre-defined clinical outcome ends up statistically significantly better in active than in placebo-arm participants. But a tiny effect, if consistent, can produce a positive result on a statistical test that may not be noticeable or important to patients. In that scenario the regulatory agencies could end up approving a drug from which most patients do not derive meaningful benefit.
The concept of meaningful clinically important difference, or MCID, came about as an attempt to illuminate this issue and as a potential solution. The FDA is keen for drug development to be focused on drugs that impact how people “feel, function or survive”. Defining MCID seeks to establish a relationship between somewhat abstract clinical scores and measures of function or quality of life. Typically this is captured using patient-reported outcomes (PROs) rather than physician-assessed scores like the result of a motor examination.
For instance, a 5 point increase in UHDRS total motor score clearly represents a worsening of symptoms; but it means very different things to different people. For one person it could be a trivial increase in things that are detectable to a neurologist but cause no inconvenience in everyday life; for another it could mean the difference between being able to drive and not. Clinical meaningfulness attempts to define thresholds at which a clinical change is clinically meaningful on average.
What does the Hamilton paper actually say?
In their 2023 paper, Jamie Hamilton and colleagues at CHDI Foundation set out to lay the foundations for an understanding of the clinical meaningfulness of various clinical measures we often use in HD trials. Using data from Enroll-HD, they started with the SF-12 questionnaire, a PRO that quantifies a person’s quality of life using questions like “During the past 4 weeks, have you accomplished less than you would like?”. The SF-12 is widely used across clinical fields of study.
So the SF-12 is measuring how people feel and function. But while this brings us closer, we don’t yet have a solution to the issue of defining how much difference is meaningful as opposed to merely statistically significant. For that, we need to establish thresholds for SF-12 score that define what constitutes “meaningful” difference for patients.
This had never been done in HD, so Hamilton and colleagues had to look to other diseases to see whether they had solved this problem in a helpful way.
In the field of Parkinson’s disease (PD), MCID work has been going on for a long time. PD is a slowly-progressive neurodegenerative disease like HD so it could be very helpful.
Back in 2010, PD researchers set out to “anchor” traditional physician-assessed clinical scores to change in SF-12. Their starting point was to establish how other disease areas had decided what change in SF-12 score was considered mild, moderate or large by patients.
It turned out that the field of “clinical meaningfulness” had defined SF-12 cutoffs by reference to data from large trials in stroke, epilepsy and various chronic medical conditions. In general these studies took the approach of looking at the relationship between clinical scores and PROs, then having established that the clinical scores are predictive of change in PRO, trying to establish what size of change in PRO in turn predicts “hard” outcomes like loss of work, death or hospitalization.
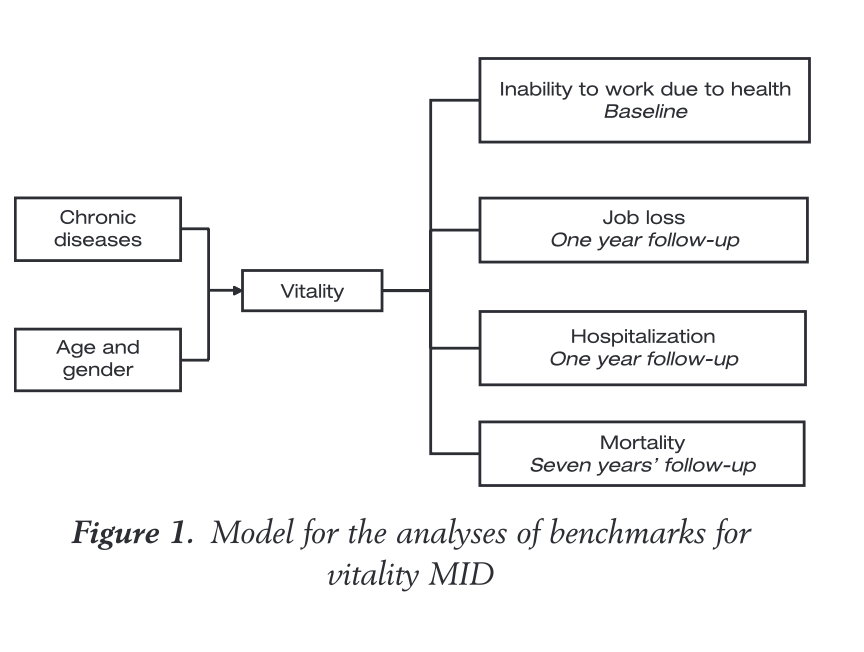
The chain of evidence for defining minimally clinically important differences (MCID) flows from physician-assessed clinical scores to PROs (in this case a measure of vitality) to hard outcomes like medical retirement or death. This example is for hypertension from Bjorner et al 2008, whose methods were cloned when MCID became of interest to the field of neurodegeneration.
If this seems circular, it’s because it is. We started by deciding that how the patient feels or functions is important in itself, but the way the field defined how much change in the PRO was “meaningful” was on the basis of what PRO change predicted hard non-patient-reported outcomes like death or hospitalisation. The basic problem is that there is no ground truth here: Most patients would agree that disease progression leading to unemployment is undesirable – but defining PRO cutoffs on the basis of those “hard” outcomes is indirect at best. Even the PROs like SF-12, which contain specific questions about how a patient feels overall, do not come with built-in thresholds for what constitutes meaningful change – it has to be inferred from other measures considered to be objective.
In any event, from outside the CNS, we get a general sense of how much change in a PRO is likely to predict a poor objective outcome. That amount of change is then declared to be the minimum clinically important difference or MCID. Other fields like PD can then come along and say “the cardiovascular field found that a small but meaningful change in the SF-12 was 3-5 points and a moderate meaningful change was 9-10 points”.
Crucially, these MCID thresholds are categorically not defined by asking participants directly “how much clinical change is meaningful to you?” or “is how you’ve changed in the past year meaningful?” – they are based on what change in PRO is predictive of hard clinical outcomes like death or unemployment.
Recall that the FDA wants “measures of how a person feels, functions or survives“. But the established method is really more like “measures of how a person feels that predict how they will function or survive in the future”. We must not forget that, and we must bear it in mind when it comes to interpreting such measures.
With this backstory in place though, it was perfectly reasonable for Hamilton and colleagues to adopt a similar approach in the first serious attempt to define MCIDs for Huntington’s disease. The Enroll-HD study collects SF-12 data alongside all the usual physician-administered clinical assessment tools. Hamilton and colleagues did not try to start from scratch, creating the chain of evidence seen in the figure above from clinical scores to PRO thresholds to later hard clinical outcomes. Instead, they borrowed the SF-12 thresholds that had been decided upon as “meaningful” for Parkinson’s disease, which in turn came from huge studies in other diseases. This was a standard approach for addressing the issue in a new brain disease, but it’s important background for understanding what the results do and don’t tell us.
From here it’s straightforward: Hamilton and team borrowed MCID thresholds for the SF-12 from PD work, and looked at what change in HD clinical measures were typically associated with that degree of SF-12 change in HD. Because HD does not progress linearly, it made sense to do this separately for each of the broadly-defined stages of HD that are most strongly represented in Enroll-HD: ISS stages 0-1 (no symptoms), stage 2 (symptoms but no functional impairment) and stage 3 (symptoms with functional impairment).
The result of this analysis was a table showing what change in each clinical score was predictive of a “small but meaningful change” 5-point change in SF-12 over 12, 24 or 36 months.
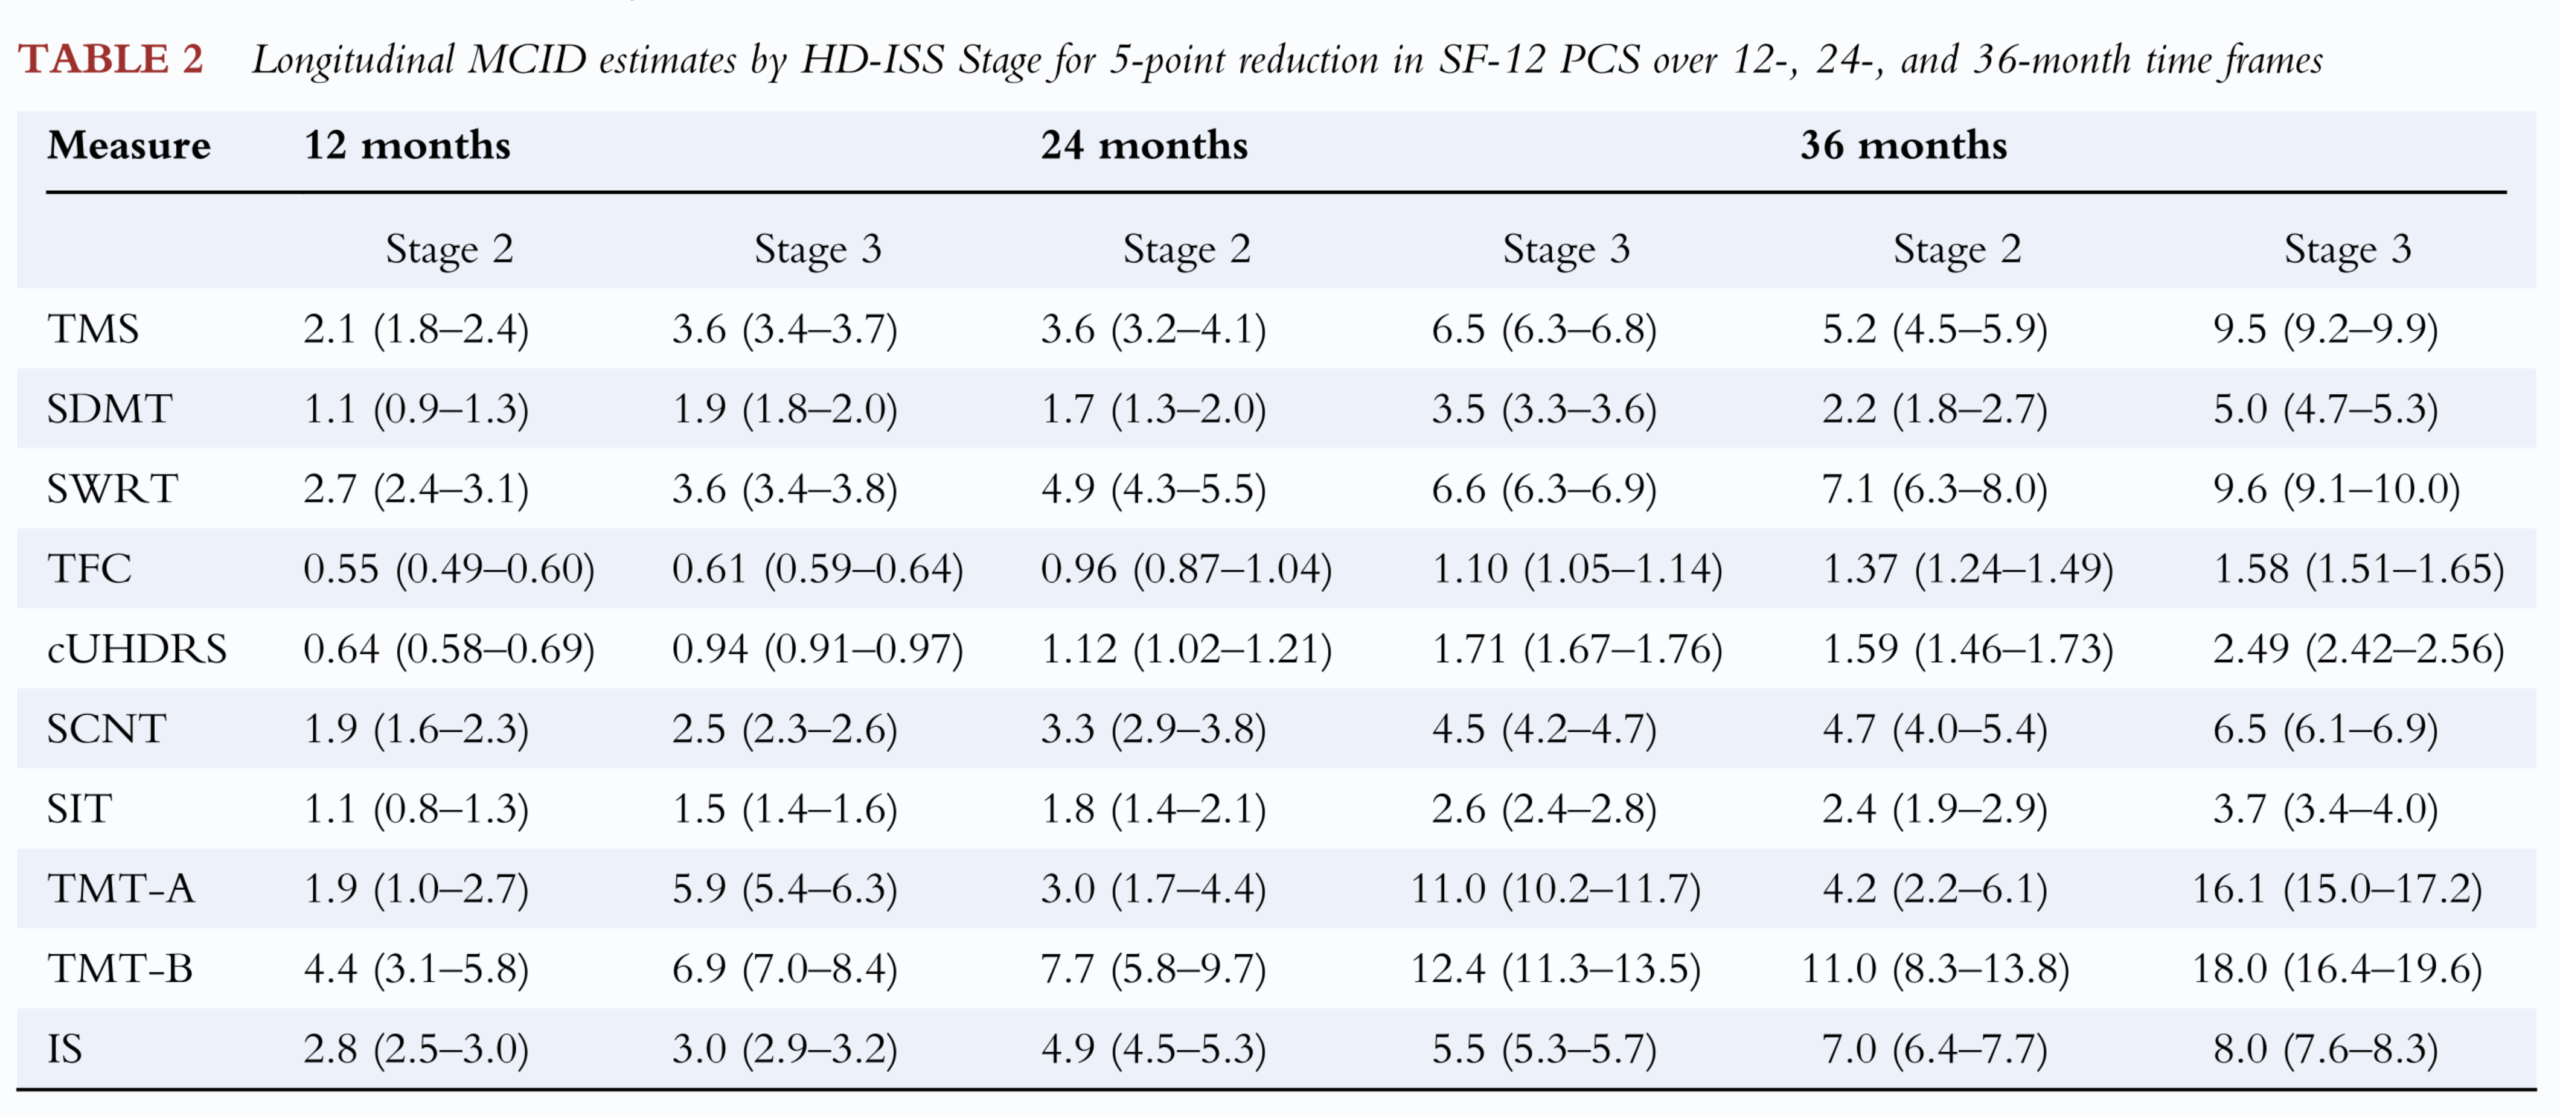
The Hamilton paper’s table of MCID values, essentially encompassing each clinical score’s ability to predict change of 5 points in SF-12 over a given interval.
These are the numbers, then, that have been the focus of some attention in the wake of the AMT-130 announcement. Understandably, some have looked at the amount of change over 3 years in the trial (the cUHDRS deteriorated by 1.14 points less in high-dose AMT-130 participants than in the external comparator arm) and concluded that because 1.14 is less than 1.59 or 2.49, the outcome must lack clinical meaningfulness.
The Hamilton paper is correct, but applying it to clinical trial data in such a simple way is plain wrong, and here’s why.
Here’s why it’s wrong
I must admit that when I first saw these critiques about clinical meaningfulness I was a bit lost as to what to make of them. Like nearly everyone else in the field, I had seen the Hamilton paper and thought “oh, that will be useful once we see something that works” – without any thought as to how we might actually do this in a way that reveals some useful truth.
A big clue comes from how all these thresholds were derived. In essence, thousands of people with hypertension were asked how tired they felt (the PRO), then they were followed until they died. After they died, the amount of tiredness that predicted premature death was calculated. Then the change in clinical score that predicted that amount of tiredness was calculated. That was declared to be the MCID for hypertension. The PRO thresholds were lifted from hypertension to PD and from PD to HD.
A few things are apparent from this history lesson:
- Despite the name, the MCID thresholds are not a simple statement of “what patients find to be meaningful”: they are the PRO change that eventually predicts hard clinical outcomes including death or hospitalization.
- All the MCID thresholds in the Hamilton paper come from longitudinal observational studies: they are the amount of disease-related deterioration over time that produces a PRO change defined as “meaningful”. What they are not is values that must be reached for a deflection of longitudinal change in a clinical trial to be meaningful to patients.
I was greatly helped in my understanding by Cristina Sampaio, the Chief Medical Officer of CHDI Foundation, who prior to joining HD held a senior role at the EMA, the medicines regulator for the European Union. Needless to say Cristina knows a lot more more about MCID and what it can tell us than me, and more than most people currently working in HD or neuroscience in general.
Of the emerging critique of MCID in the UniQure programme, Cristina said, “The concept of minimal clinical difference was originally developed for improving changes. Later, it was adapted for changes in deterioration, but humans have much difficulty in perceiving slow deterioration versus short-term improvement. Therefore, the values that are found are typically large. The only way to get out of this is to say that minimal clinical change in deterioration is, for the reasons explained and because the disease is very slow progressing, a crude method to evaluate the value of an intervention.”
Cristina and I have not always agreed over the 12 years we’ve known each other – but I think this is spot on, and gets to the heart of the issue. We cannot understand the Hamilton paper without first understanding the two points above, and Cristina’s caveat. Even if we understand and accept point 1 (MCID is not determined by what people actually find meaningful but rather by how a PRO predicts hard clinical outcomes), there is no getting away from point 2 (MCID is not the same as what a trial must achieve to be truly clinically meaningful).
What is the right way to think about this then?
Huntington’s disease is a really challenging condition for which to usefully define clinical meaningfulness. We can often make someone feel better quite quickly in HD, by treating abnormal movements or depression – and we might be able to interpret the results of doing so in the light of the MCID model, since this would be a quick positive change which is much easier for humans to perceive.
But what we are trying to do above all in HD, is slow or reverse the fundamental neuropathological problem in the brain, with the aim of delaying or preventing onset and progression. There is no reasonable expectation that would produce rapid improvement as opposed to delaying of progression. Indeed, our best expectation from current trials is that treated participants will still experience progression, but it will happen more slowly. This places pre-defined MCID thresholds at an additional disadvantage in all of our work, for the “human perception” reasons Cristina mentions.
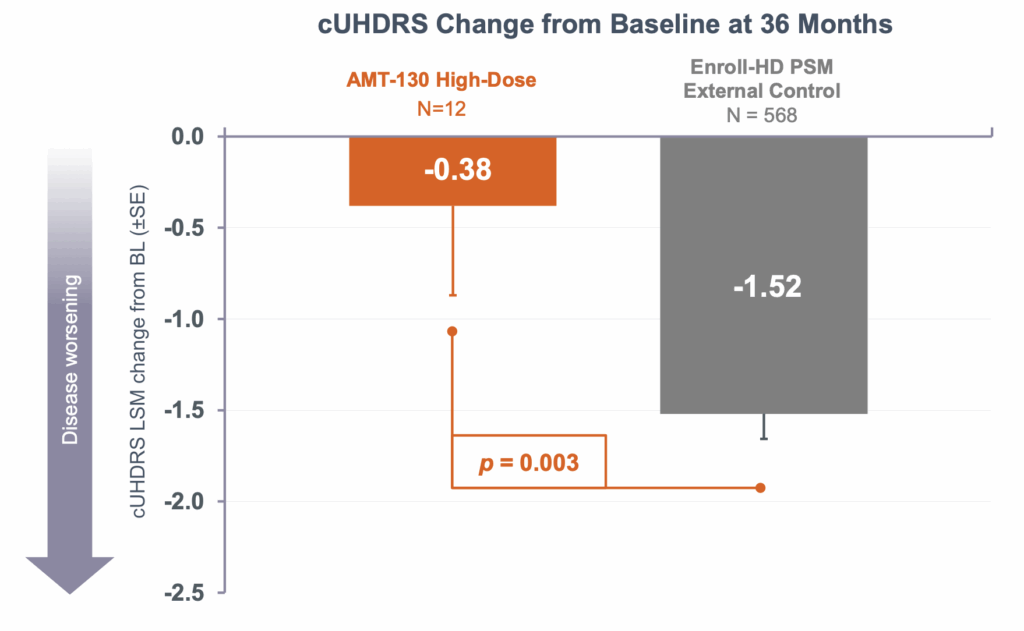
Let’s return to the example I gave at the top. The high-dose patients in the AMT-130 trial had a 75% reduction in progression as measured by a composite score, the cUHDRS, that includes motor, cognitive and functional components. But despite this, over the three years of this trial, they still deteriorated by 0.38 points on average, albeit compared against the 1.52 point decline in the external comparator arm. So how can we usefully figure out whether this slowing of decline is “meaningful”?
The answer, Cristina advises, is modelling. “We can offer a simulated example that if a drug halted progression completely, most likely people would only recognize it after 3 or 4 years. That is why in Alzheimer’s disease, people are converting trial results into time saved. A 27% change in AD equals 5 months saved. We need to do these calculations as well for the Uniqure data.”
I can’t do this kind of modelling, but CHDI knows people who can, and it’s underway. What I can do is a thought experiment extrapolating from the data we already have.
A thought experiment extrapolating from the data we already have
Let’s follow Cristina’s suggestion of trying to model time lost and time reclaimed. The average progression in cUHDRS in the AMT-130 control cohort was 0.5 points per year, and in the treated patients was about 0.13 points per year. Extrapolating is a simple case of arithmetic. How long it would take for the treated patients to experience the same amount of progression that the control participants experienced in 3 years. At 0.13 points per year, that would be 1.52/0.13 = 11.7 years. The difference being 8.7 years.
Let me say that again in bold, in its own dedicated paragraph.
Based on cUHDRS results from within the trial, high-dose AMT130-treated patients would take 11.7 years to reach the point that the control participants reached after 3 years.
Does that seem meaningless to you? Because to me, it does not.
Now let’s think about preventing onset in ISS stage 0-1 patients. We’ll be super-conservative and imagine that the real-life effect size for slowing disease progression is not 75% but just 25%. And let us imagine Alex, a 20-year-old with a positive HD genetic test, who would be expected to reach clinical motor diagnosis at age 40, i.e. 20 years in the future.
Let us say, arbitrarily, that the amount of healthy neurons Alex needs to lose from now, before reaching motor diagnosis, is one million. Alex’s current rate of progression can therefore be crudely represented as 50,000 neurons per year, assuming the rate of neurodegeneration is roughly constant.
If we slow that rate of progression by a quarter, the rate of neuronal loss is reduced to 37,500 per year. Instead of 20 years, it now takes Alex 26.7 years to lose that million neurons. That’s nearly seven more years of complete disease freedom.
Again, to me, that seems meaningful, and these are not wildly implausible assumptions: the 25% effect size is only a third of what was seen in this trial. The neuron numbers in this experiment are entirely arbitrary, but the number of years gained by a given % slowing is not.
This was just a thought experiment, albeit one cautiously informed by data from the trial and the very literature that has been used to critique the “clinical meaningfulness” of the result.
What we do not have, yet, is a dedicated study, based on modelling and perception of meaningfulness, that can tell us in a much more robust way, whether these delays would indeed be meaningful to participants. I hope that someone who lives and breathes this stuff is working on such a publication, because clinical meaningfulness is important, but it’s only meaningful if we understand what it really means.
For now though
For now though, I will conclude with a couple of suggestions:
- If you are going to talk about clinical meaningfulness, please be familiar with what it is, what it isn’t, where the numbers come from, how they can and cannot be applied to the result of a trial, and what might be a better way to answer these questions.
- A good place to start would be to ask HD-impacted people directly what would actually represent a meaningful degree of disease slowing for them.